Answer the following questions to better understand the storyboard above.
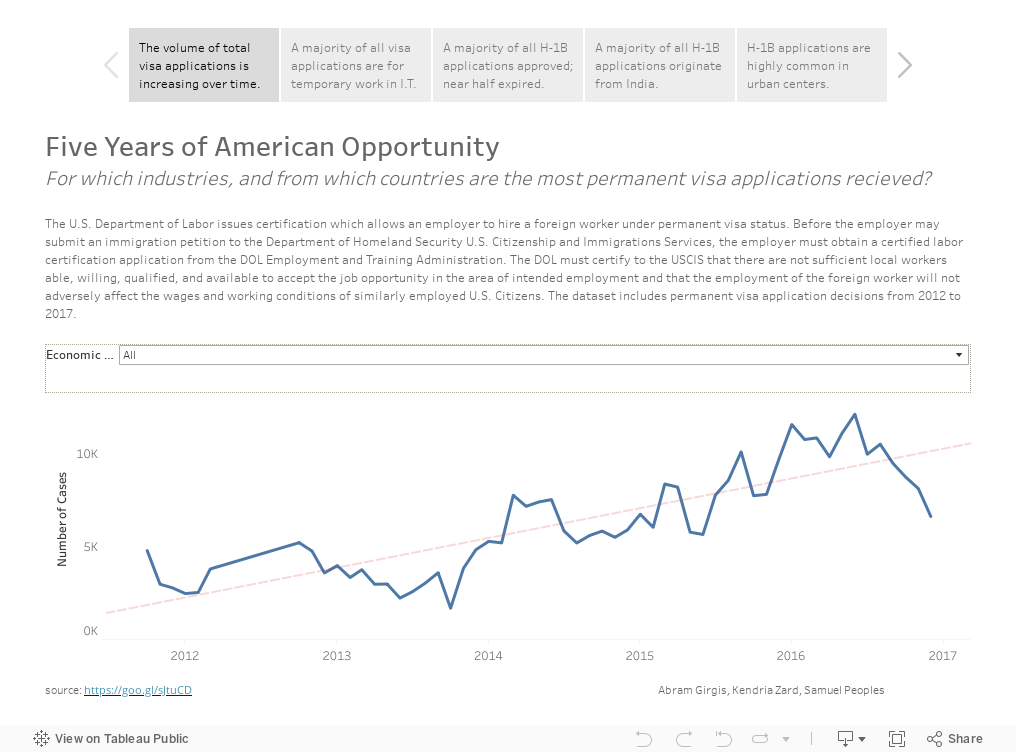
- What is the trend of all permanent visa applications over time? In which year did the number of applications reach its maximum, and in which year is the minimum? (Slide 1)
- What year has the greatest percent of certified H-1B visas? (Slide 3)
- In 2016, from which countries were positions in Law applied? (Slide 4)
- In what ways are applications for employment in Healthcare clustered differently than those for Industrial employment? What about Management? (Slide 5)
1. The trend of all permanent visa applications is increasing.
ReplyDelete2. 2016 has the greatest percent of certified H-1B visas with 92.79%
3. India and Taiwan
4. I chose to focus on 2016 and there are more applications for industrial scattered throughout the map compared to Healthcare. While focusing on South America in 2016, More applications for Healthcare in the Southern parts of South America and more applications for Management in the Northern areas of South America.
1) The trend of all permanent visa applications is increasing. In June 2016, the number of applications reached its maximum. In October 2013, the number of applications reached its minimum.
ReplyDelete2) Year 2016 had the greatest percent of certified H-1B visas with 92.79% being certified.
3) India and Taiwan
4) In healthcare, the applications for employment were mainly clustered on the right side of the US while the industrial applications were mainly on the East Coast/South. For management, they are scattered all over the US but the biggest points were in the biggest cities in the US.