You have been approached by a Venture Capital Fund. The Board of Directors are currently reviewing 1000 potentially interesting startups and deciding on which ones they are going to invest in.
The criterion for selecting investments for this fund is a combination of:
- High revenue (2015)
- Low expenses (2015)
- Top growth (2015)
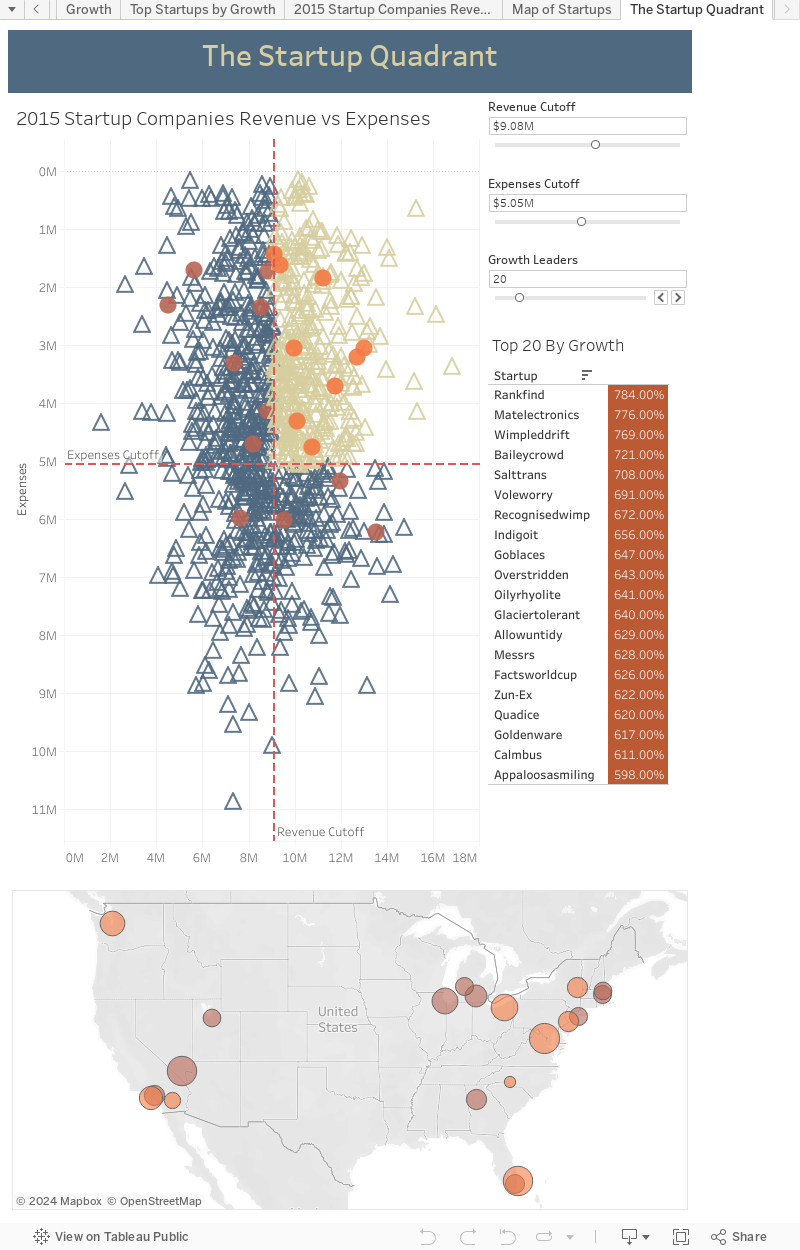
Your task is to assist the Board in identifying which businesses represent the best investment opportunities.In the visualization below, we'll accomplish the task set out in the scenario. We first notice that there is a Revenue versus Expenses scatterplot with some sliders and a reference legend, followed by a map which has similar coloring as the plot above.
Notice that the Expenses axis is reversed. This was done because it's much more intuitive to look for the desirable entries in the top-right of the figure, and since we are looking for high revenue, and low expenses, this layout accomplishes that goal.
Observe that the slider labeled "Growth Leaders" controls the shape and color of the top selected startup companies by Growth. This let's the viewer visualize their top performing investment opportunities.
We also see that there are two reference lines labeled "Revenue Cutoff" and "Expenses Cutoff". This allows the viewer to use the relevant sliders to control for their desired investment opportunities. We see that those companies that fall within the first quadrant (Upper-Right) are colored with a bright red, while those that fall outside are colored with a darker shade.
The map below allows the Venture Capital Fund visualize their potential investments, allowing them to take the geographic element into consideration. This is extremely helpful when making decisions between states with higher taxes or regulations, or when local economies are outperforming others within the nation.
With these features, the Board of Directors is able to take this sample of 1000 startups, and reduce their search to the Top 20 Startups by Growth, which is then further reduced to the Top 9 Startups by Growth with Expenses no greater than $5M, and Revenue no less than $9M. The interactive nature gets the viewer at the ground-level with the data, and guides them to well-founded, and pragmatic conclusions.
This dashboard was developed as the second part to a larger Udemy Advanced Tableau course. Here's a link to the github:
https://github.com/SLPeoples/Advanced-Tableau-DS
No comments:
Post a Comment