Within the Jupyter notebook below, the income and spending score were used to conduct the classification after noticing that the age and gender had no significant impact on the spending score. The "Elbow Method" was implemented to determine the optimal number of clusters for our analysis. In the visualization, a good choice looks to be five.


Once we've found our optimal number of buckets, the two chosen columns are fitted to the K-Means clustering algorithm.
We then visualize our predictions in Python, but ultimately decide that Tableau will more clearly describe our dataset.
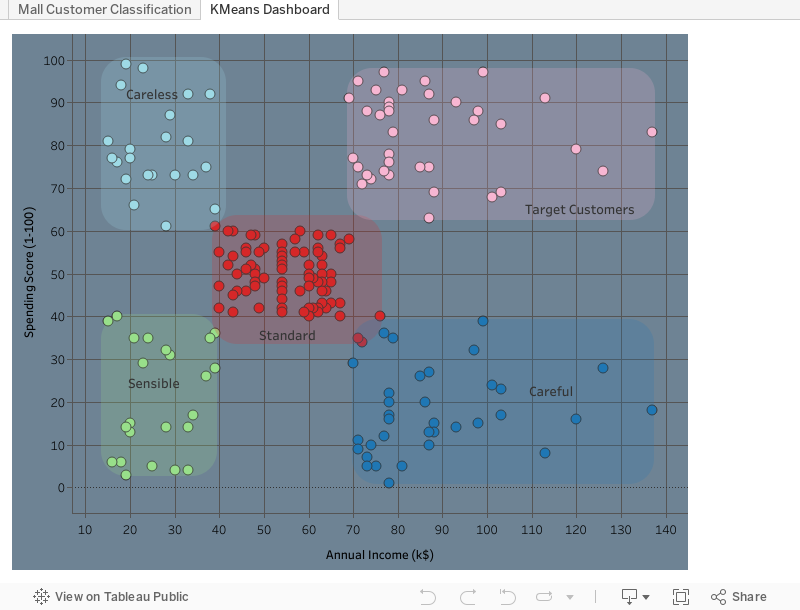
Using the dashboard above, the customers can be clearly seen in their appropriate clusters. It's evident that the choice of five clusters was ideal, and that the "Target Customers" are well defined. I found this exercise to be really useful, and you're more than welcome to give it a shot! I've embedded the jupyter notebook below, and linked to the github as well.
github:
https://github.com/SLPeoples/Machine-Learning-A-Z/tree/master/Part%2004%20-%20Clustering/24_K_Means
your article on data science is very good keep it up thank you for sharing.
ReplyDeleteData Science course in Hyderabad